Performance/Weight and Balance#
Weight & balance terms, principles, calculations & weight shift#
Terms#
- balance
The location of the CG of an aircraft.
- stability
The ability of the aircraft to maintain or return to its original flight path.
Primary concern is fore/aft center of gravity along the longitudinal axis (running from nose to tail).
- arm/moment arm
Horizontal distance in inches from the datum line to the CG of an item (+ if aft of the datum, - if fore of the datum).
- basic empty weight
Standard empty weight plus optional/special installed equipment.
- center of gravity (CG)
The point at which the aircraft would balance if suspended at that point.
- CG limits
Forward and aft points within which the CG must be located during flight.
- CG range
Distance between forward and aft CG limits.
- datum
Imaginary vertical plane from which all measurements of arm distance are referenced.
- floor load limit
Maximum weight the floor can sustain per square inch/foot.
- fuel load
Usable fuel load of the aircraft.
- licensed empty weight
Empty weight consisting of airframe, engine, unusable fuel, undrainable oil, and standard and optional equipment as specified in the equipment list.
- maximum landing weight
Greatest weight an aircraft is normally allowed to have at landing.
- maximum ramp weight
Total weight of a loaded aircraft including all fuel (higher than takeoff weight to account for ground operations).
- maximum takeoff weight
Maximum allowable weight for takeoff.
- maximum weight
Maximum authorized weight of the aircraft and all of its equpiment.
- maximum zero fuel weight
Maximum weight, excluding usable fuel.
- mean aerodynamic chord
The average distance from the leading edge to the trailing edge of the wing.
- moment
Product of weight of an item multiplied by its arm, typically expressed in pound-inches (in-lb). Total moment is the weight of the airplane multiplied by the distance between the datum and the CG.
- moment index
Moment divided by a constant such as 100, 1,000, or 10,000. Used to simplify weight and balance computations when dealing with large, unmanageable numbers.
- payload
Weight of occupants, cargo, and baggage.
- standard empty weight
Aircraft weight consisting of airframe, engines, and all items of operating equipment that are permanently installed (including ballast, hydraulic fluid, unusable fuel, and full engine oil).
- standard weights
Established weights for numerous items involved in weight and balance computations.
Gasoline (6 lb/gal)
Jet A, Jet A-1 (6.8 lb/gal)
Jet B (6.5 lb/gal)
Oil (7.5 lb/gal)
Water (8.35 lb/gal)
- station
A location in the aircraft identified by a number designating its distance in inches from the datum (e.g. station +50 has an arm of 50 inches).
- useful load
Weight of pilot, copilot, passengers, baggage, usable fuel, drainable oil—essentially, useful load = maximum allowable gross weight - basic empty weight (applicable to GA aircraft only).
Principles#
CG is usually placed slightly forward of center of lift to provide the necessary elevator authority and longitudinal stability. It causes a nose-down tendency, which helps to prevent stalls at high AOA or slow speeds.
Forward and aft CG limits define the safe zone.
Although an aircraft is certified for a specified max takeoff weight, it may not be true in all conditions; high altitude, high temperature, and high humidity can reduce performance.
A pilot should always be sure that an aircraft is properly loaded.
Calculation#
Computational Method#
List items weights, arms, and calculate moment (product of weight and arm).
Item |
Weight |
Arm |
Moment |
|---|---|---|---|
Aircraft Empty Weight |
2,100 |
78.3 |
164,430 |
Front Seat Occupants |
340 |
85.0 |
28,900 |
Rear Seat Occupants |
350 |
121.0 |
42,350 |
Fuel |
450 |
75.0 |
33,750 |
Baggage Area 1 |
80 |
150.0 |
12,000 |
Total |
3,320 |
281,430 |
CG = 281,430 / 3,320 = 84.8
Graph Method#
Instead of calculating moment yourself, you trace the weight line for an item up the graph until you hit the desired value, then follow the vertical lines down to the moment value and place that in a table. Total the weight and moment columns, and find their intersection on a moment envelope graph.
Table Method#
Tables are similar, except that now you have to interpolate between values if necessary. Continue to sum weights and moments, and compare it to the forward and aft limit.
Weight Shift#
Weight shifting from one location to another changes the CG without changing the total weight of the aircraft:
If you’re adding or removing weight, it also changes the CG:
Performance speeds#
- true airspeed (TAS)
The speed of the aircraft in relation to the air mass in which it is flying
- indicated airspeed (IAS)
The speed of the aircraft as observed on the ASI. It is the airspeed without correction for indicator, position (or installation), or compressibility errors.
- calibrated airspeed (CAS)
The ASI reading corrected for position (or installation) and instrument errors. (CAS is equal to TAS at sea level in standard atmosphere.) The color coding for various design speeds marked on ASIs may be IAS or CAS.
- equivalent airspeed (EAS)
The ASI reading corrected for position (or installation), for instrument error, and for adiabatic compressible flow for the particular altitude. (EAS is equal to CAS at sea level in standard atmosphere.)
- \(V_{\text{S0}}\)
The calibrated power-off stalling speed or the minimum steady flight speed at which the aircraft is controllable in the landing configuration.
- \(V_{\text{S1}}\)
The calibrated power-off stalling speed or the minimum steady flight speed at which the aircraft is controllable in a specified configuration.
- \(V_Y\)
The speed at which the aircraft obtains the maximum increase in altitude per unit of time. This best ROC speed normally decreases slightly with altitude.
- \(V_X\)
The speed at which the aircraft obtains the highest altitude in a given horizontal distance. This best AOC speed normally increases slightly with altitude.
- \(V_{\text{LE}}\)
The maximum speed at which the aircraft can be safely flown with the landing gear extended. This is a problem involving stability and controllability.
- \(V_{\text{LO}}\)
The maximum speed at which the landing gear can be safely extended or retracted. This is a problem involving the air loads imposed on the operating mechanism during extension or retraction of the gear.
- \(V_{\text{FE}}\)
The highest speed permissible with the wing flaps in a prescribed extended position. This is because of the air loads imposed on the structure of the flaps.
- \(V_A\)
The calibrated design maneuvering airspeed. This is the maximum speed at which the limit load can be imposed (either by gusts or full deflection of the control surfaces) without causing structural damage. Operating at or below maneuvering speed does not provide structural protection against multiple full control inputs in one axis or full control inputs in more than one axis at the same time.
- \(V_{\text{N0}}\)
The maximum airspeed for normal operation or the maximum structural cruising speed. This is the speed at which exceeding the limit load factor may cause permanent deformation of the aircraft structure.
- \(V_{\text{NE}}\)
The speed that should never be exceeded. If flight is attempted above this speed, structural damage or structural failure may result.
Performance charts#
- performance charts
Allow a pilot to predict the takeoff, climb, cruise, and landing performance of an aircraft.
Density altitude charts#
If the airport altimeter setting is 30.10 “Hg and the airport elevation is 5,883 feet, from the conversion chart, you must subtract 165 feet from the airport actual altitude to get pressure altitude. You can then use the outside air temperature to get density altitude.
Factors affecting performance#
As air becomes less dense, it reduces:
power, because the engine takes in less air
thrust, becuase the propeller is less efficient in thin air
lift, because thin air exerts less force on the airfoils
Pressure varies with altitude and temperature. A standard atmosphere at sea level is \(15 ^\circ C\) or \(59 ^\circ F\) and a surface pressure of 29.92 inches of mercury (“Hg) or 1013.2 millibars (mb).
A standard temperature lapse rate is \(2 ^\circ C\) (\(3.5 ^\circ F\)) per thousand feet up to 36,000 feet. Above this point, temperature is considered constant up to 80,000 feet.
A standard pressure lapse rate is approximately 1 “Hg per 1,000 feet of altitude gain up to 10,000 feet.
This, established by the International Civil Aviation Authority (ICAO) is known as International Standard Atmosphere (ISA) or ICAO Standard Atmosphere.
- pressure altitude
Height above the standard datum plane (SDP). If the altimeter is set to 29.92 “Hg SDP, the altitude indicated is the pressure altitude—the altitude in the standard atmosphere corresponding to the sensed pressure.
Pressure altitude can be found by
Setting the barometric scale of the altimeter to 29.92 “Hg and reading the indicated altitude
Applying a correction factor to the indicated altitude according to the reported altimeter setting
Using a flight computer
- density altitude
Pressure altitude corrected for nonstandard temperature.
As the density of the air increases (lower density altitude), aircraft performance increases. Density altitude is used in calculating aircraft performance. Under standard atmospheric conditions, each level in the atmosphere has a specific density, and pressure altitude and density altitude identify the same level.
Air density is affected by changes in altitude, temperature, and humidity. High density altitude refers to thin air, while low density altitude refers to dense air.
High density altitude conditions:
high elevations
low atmospheric pressures
high temperatures
high humidity
Low density altitude conditions:
low elevations
high atmospheric pressure
low temperatures
low humidity
Water vapor is lighter than air, so moist air is lighter than dry air. As water content increases, air becomes less dense, increasing density altitude and decreasing performance.
- humidity
The amount of water vapor contained in the atmosphere, expressed as a percentage of the maximum amount of water vapor the air can hold (temperature dependent). Warm air can hold more, and cold air holds less.
Effects of weight, CG, density altitude & wind on performance#
Primary factors most affected by performance:
takeoff and landing distance
rate of climb
ceiling
payload
range
spseed
maneuverability
stability
fuel economy
Parasitic drag dominates at high speed, while induced drag dominates at low speed.
Takeoff, climb, landing & go-around performance#
- angle of climb (AOC)
Altitude gained relative to distance traveled
Max AOC helps taking off from a short airfield surrounded by high obstacles.
- rate of climb (ROC)
Altitude gained relative to time needed to reach that altitude
Max ROC expedites a climb to an assigned altitude.
Increase in weight, altitude, lowering the landing gear, or lowering the flaps all decrease both excess thrust and excess power and max AOC/ROC performance decreases.
If weight is added to an aircraft, it must fly at a higher AOA to maintain a given altitude and speed, increasing the induced drag of the wings and the parasite drag of the aircraft. More thrust is needed to overcome it, leaving less reserve thrust for climbing.
Climb performance diminishes with altitude.
- service ceiling
Altitude at which the aircraft is unable to climb at a rate greater than 100 feet per minute (fpm).
- region of reversed command
Flight in which a higher airspeed requires a lower power setting and a lower airspeed requires a higher power setting to hold altitude.
- best endurance speed
Location on the power curve at which the lowest brake horsepower sustains level flight.
Takeoff performance#
Any surface that is not hard and smooth increases the ground roll during takeoff. Obstructions (muddy and wet surfaces) can also act to reduce the landing distance.
- minimum takeoff distance
Distance obtained by taking off at some minimum safe speed that allows sufficient margin above stall and provides satisfactory control and initial ROC. Depending on aircraft characteristics, liftoff speed can be anywhere from 1.05 to 1.25 times the stall speed or minimum control speed.
Increased gross weight affects takeoff performance:
Higher liftoff speed
Greater mass to accelerate
Increased retarding force (drag and ground friction)
Effect of wind is large; headwind allows aircraft to reach lift-off speed at a lower groundspeed. Tailwinds require the aircraft to achieve a greater groundspeed to attain liftoff speed.
A headwind that is 10% of takeoff airspeed reduces takeoff distance by approximately 19%. A 10% tailwind increases takeoff distance approximately 21%.
Increase in density altitude can:
Require a greater takeoff speed
Result in decreased thrust and reduced net accelerating force.
When predicting takeoff distance from POH, consider:
Pressure altitude and temperature
Gross weight
Wind
Runway slope and condition
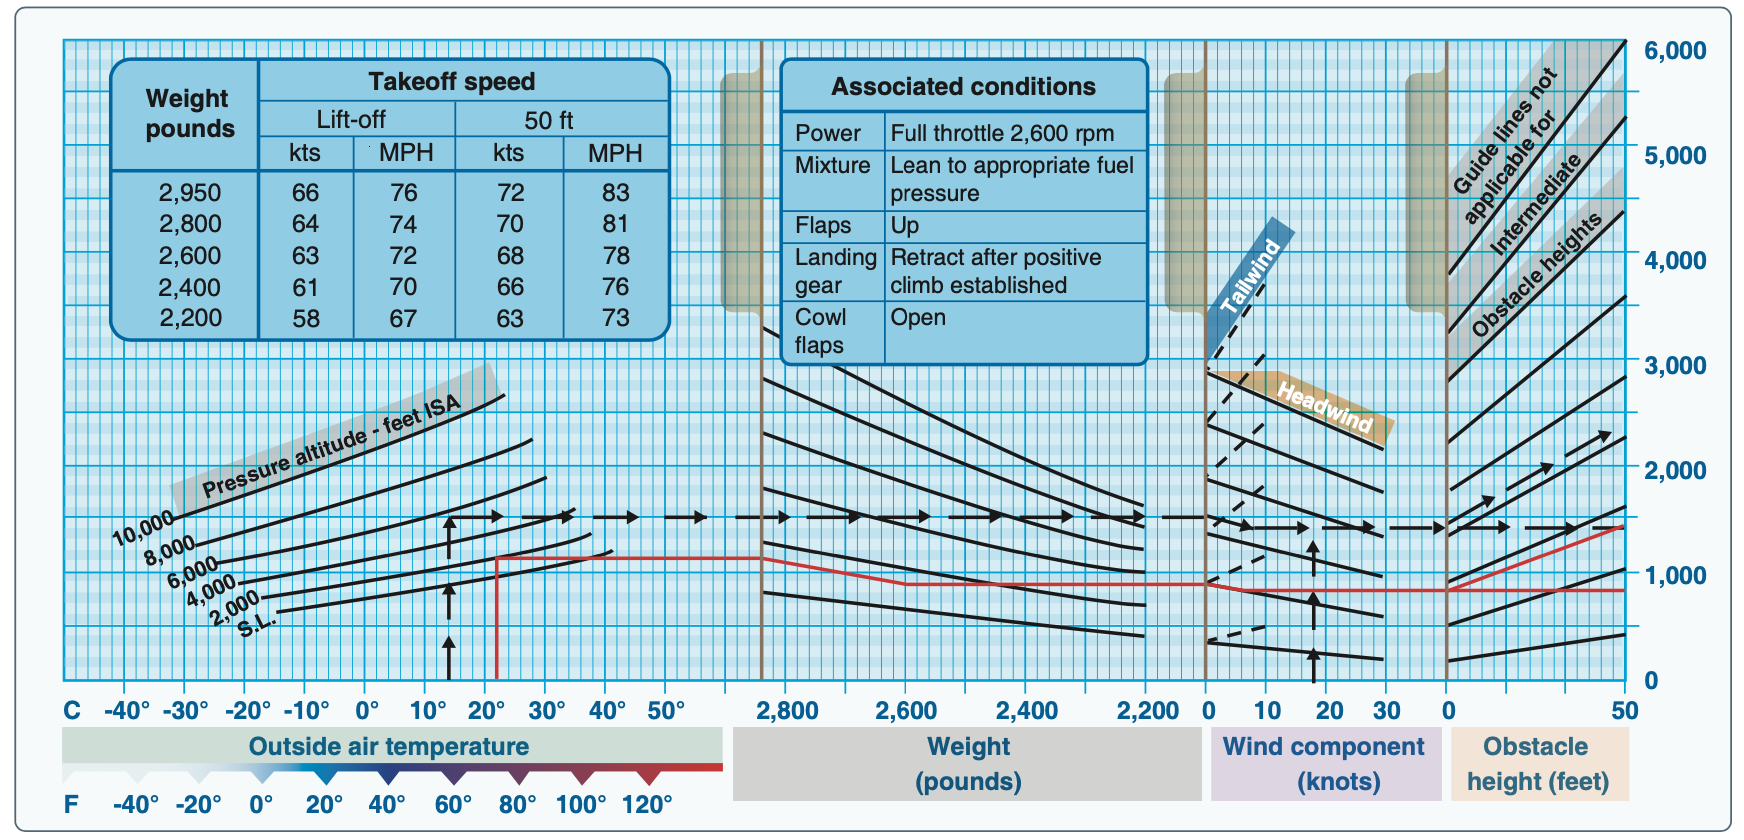
In the above (traced) example:
Condition |
Value |
|---|---|
Pressure Altitude |
2,000 feet |
OAT |
\(22^\circ \text{C}\) |
Takeoff weight |
2,600 pounds |
Headwind |
6 knots |
Obstacle height |
50 foot obstacle |
This shows a 700 foot ground roll distance and a 1,400 foot total distance required to clear a 50 foot obstacle.
Landing performance#
Effect of wind on landing distance is identical to its effect on takeoff distance.
At speeds less than 60 to 70 percent of touchdown speed, aerodynamic drag is so slight as to be of little use.
Gross weight affects landing distance; higher gross weight requires greater speed to support the aircraft at landing.
An increase in density altitude increases the landing speed. An aircraft lands at the same IAS as at sea level, but because of reduced density, TAS is greater.
A 10% increase in landing speed causes at least a 21% increase in landing distance.
Most critical conditions of landing performance:
High gross weight
High density altitude
Unfavorable wind
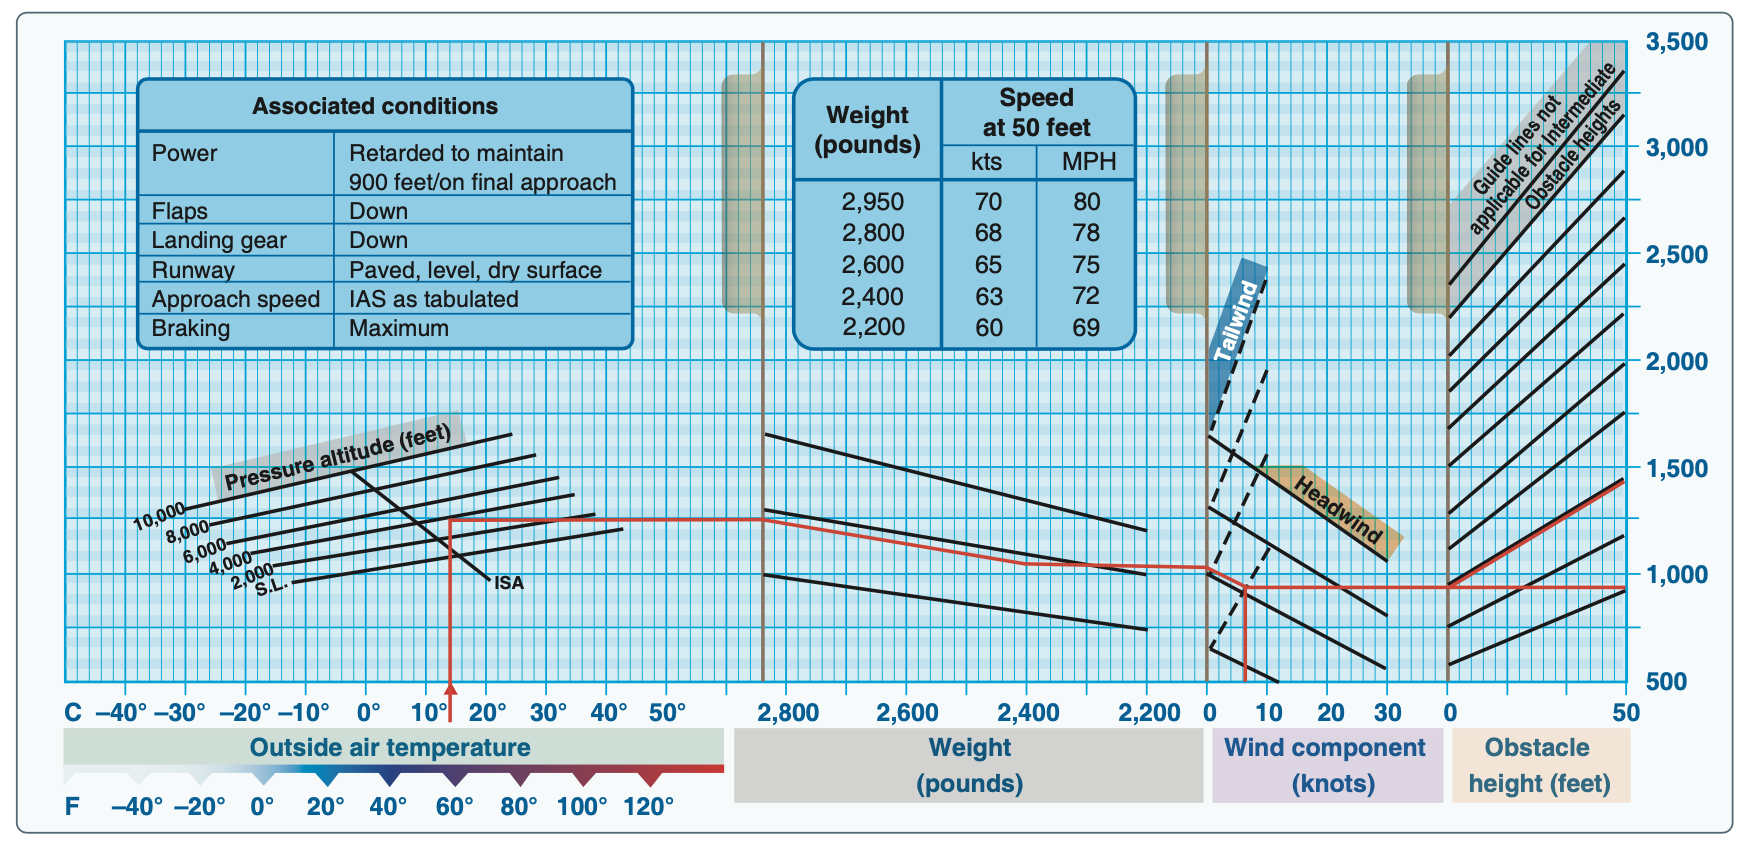
In the above (traced) example:
Condition |
Value |
|---|---|
Pressure Altitude |
4,000 feet |
OAT |
\(57^\circ \text{F}\) |
Takeoff weight |
2,400 pounds |
Headwind |
6 knots |
Obstacle height |
50 foot obstacle |
This shows a ground roll of 975 feet and a 1,500 feet required distance over a 50 foot obstacle.